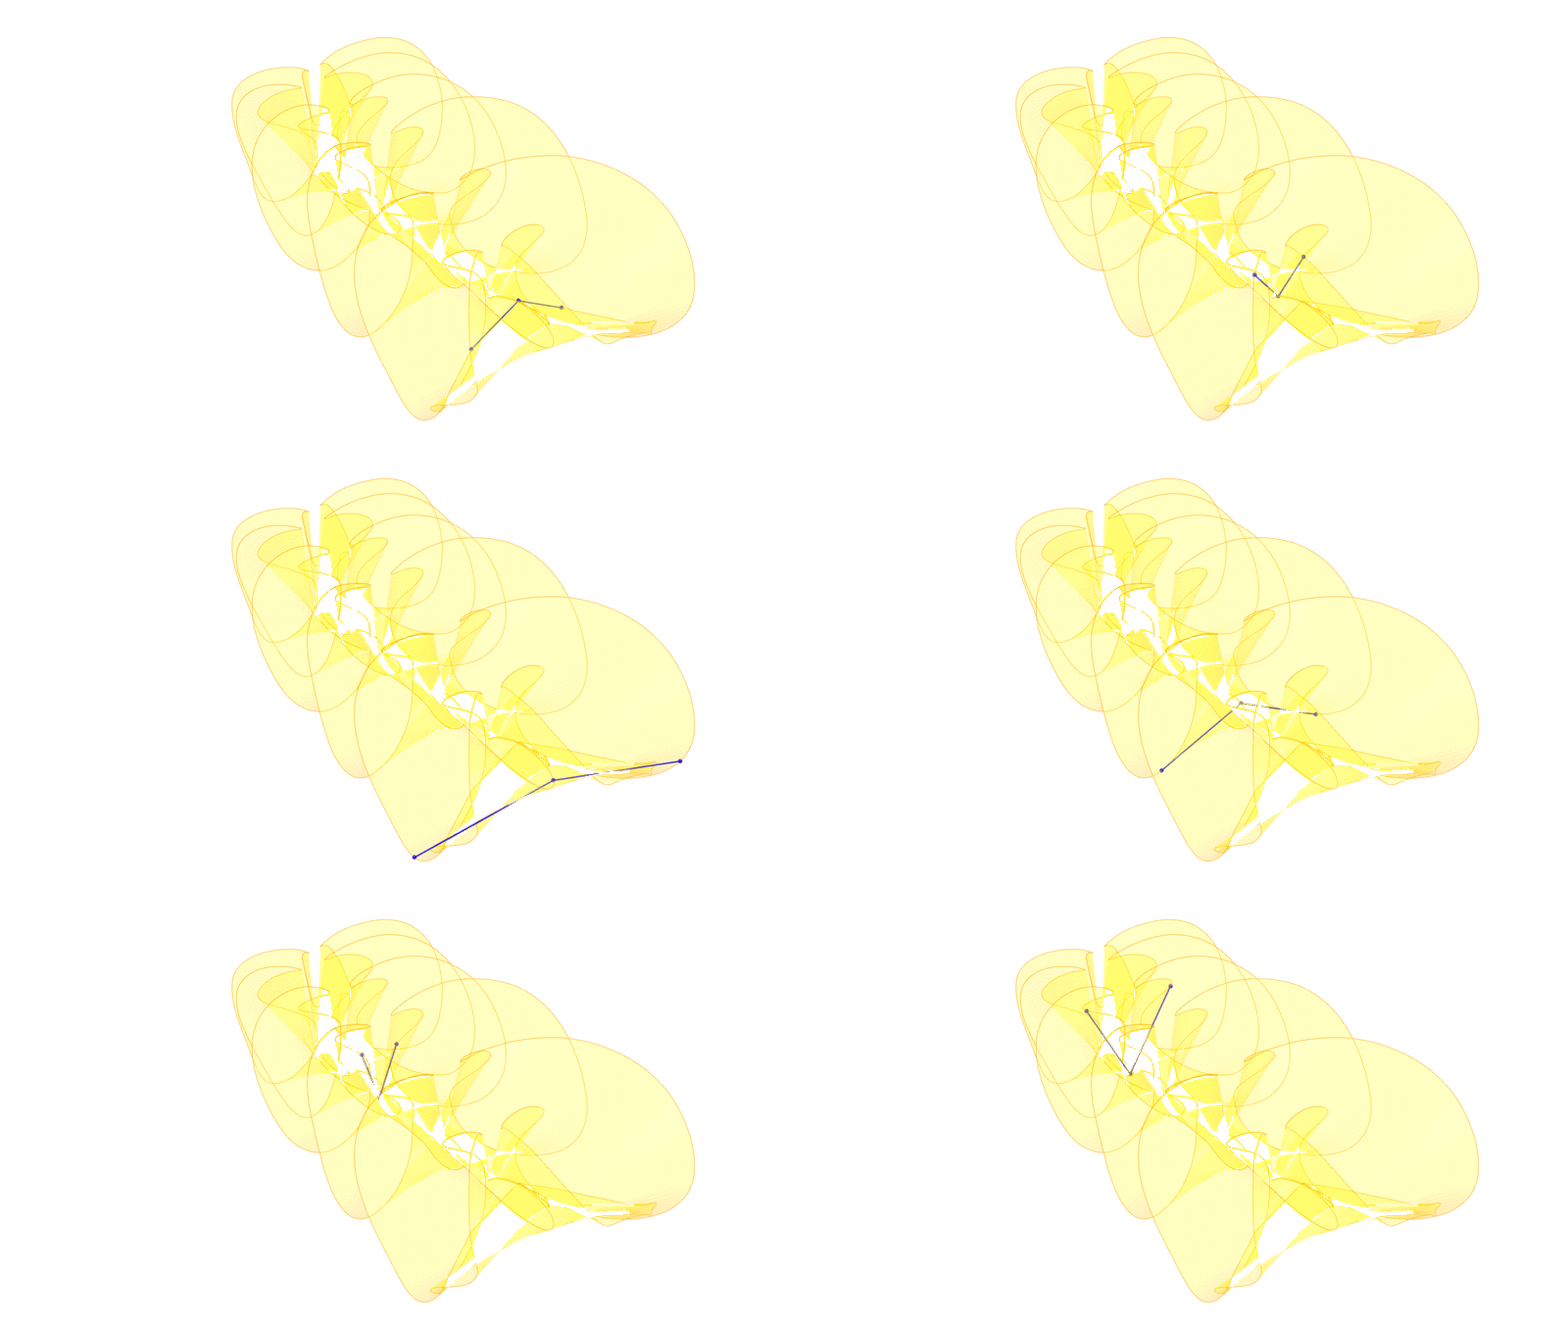
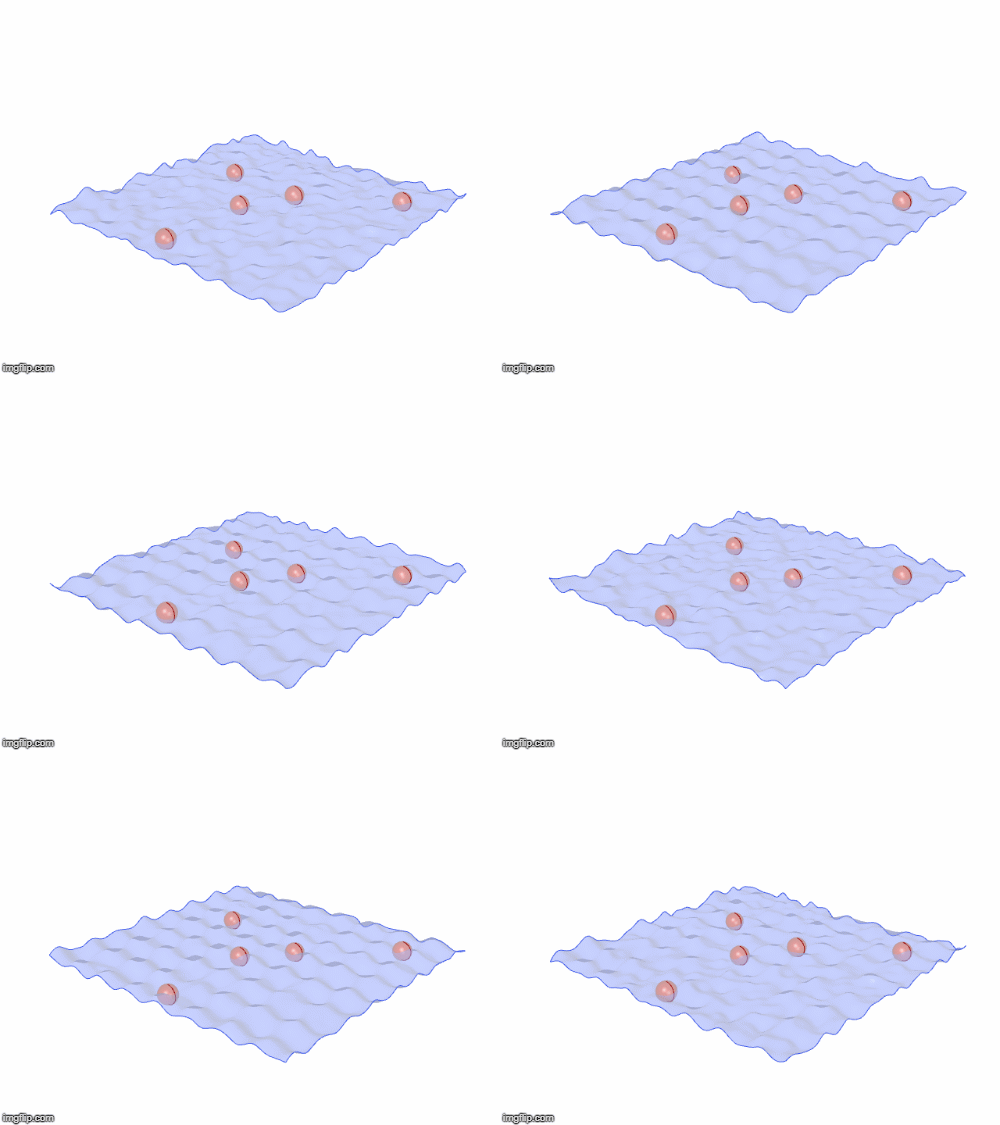
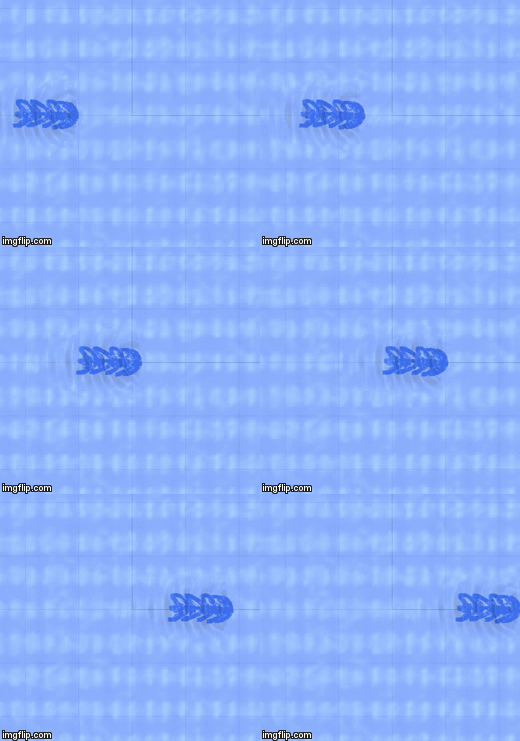
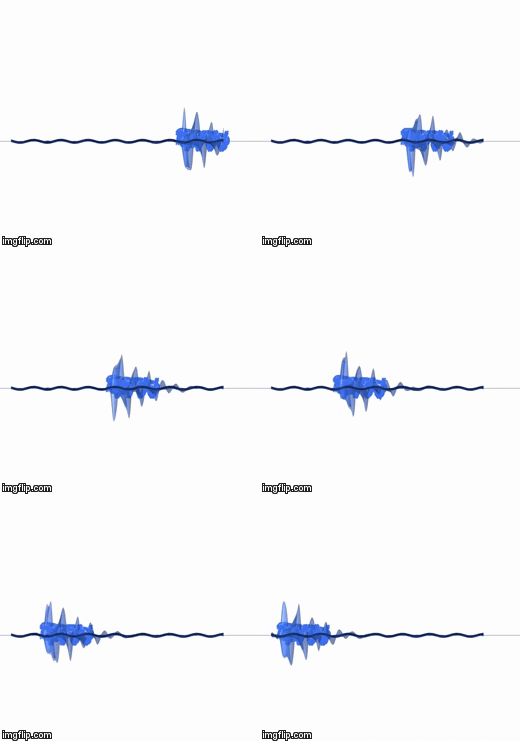
The data visualization practice is divided into three themes, (1) Butterfly stroke, (2) Water Surface, (3) Revealing Human Form. We tried to visualize the motion and solve problems.
My team performance is recorded on Jose Luis ’s Youtube Channel GSD-6338: Introduction to Computational Design | Harvard GSD, you can see my presentation in every class work review session because we really did a great job🌝️
My team performance is recorded on Jose Luis ’s Youtube Channel GSD-6338: Introduction to Computational Design | Harvard GSD, you can see my presentation in every class work review session because we really did a great job🌝️
Motion Impossible
Data VisualizationCollabrator: Mohamed Isamail, Kezi Cheng
Instructor: Jose Luis Garcia del Castillo y Lopez
Role: Formulated quantitative research methods, including biological tests, questionaire design and urban routes selection. Using visual simulation technology to compare experiment results in the virtual reality and the actual built encironment.
Toolkits: Motion Tracking, Grasshopper, C#, 3D Printing
Year: 2019







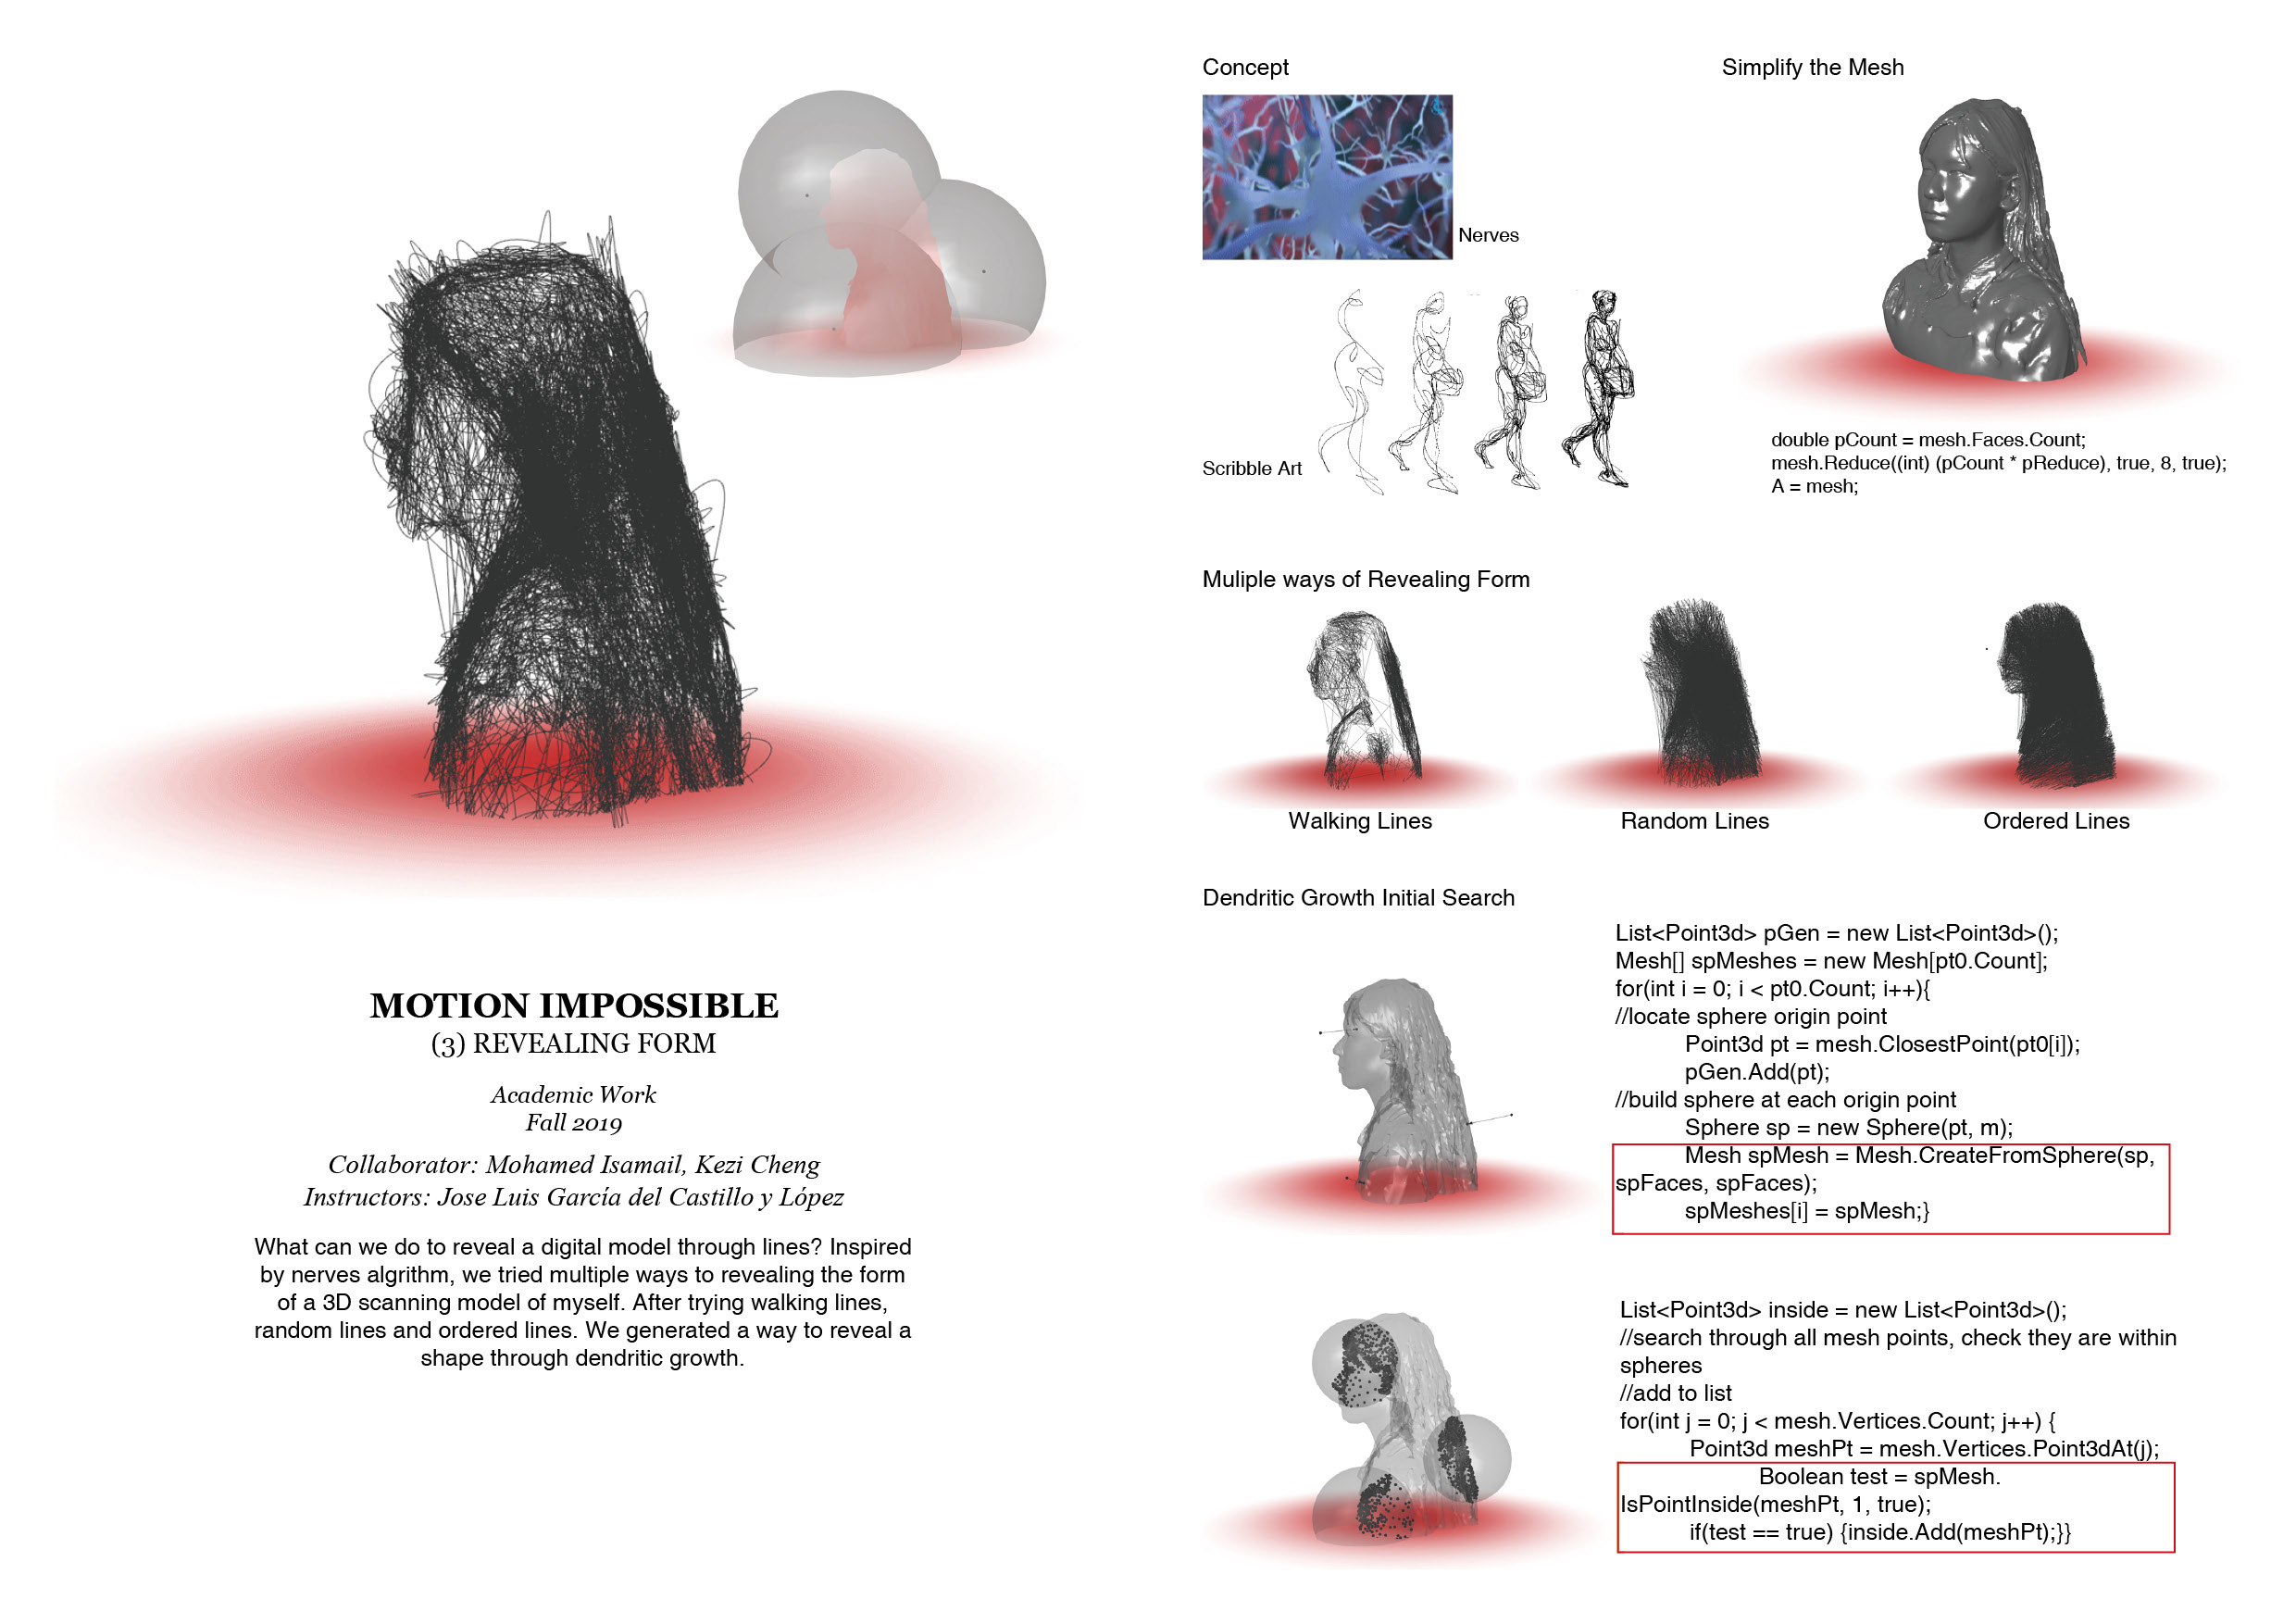

Walking lines

Random lines

Ordered lines
 Multiple ordered
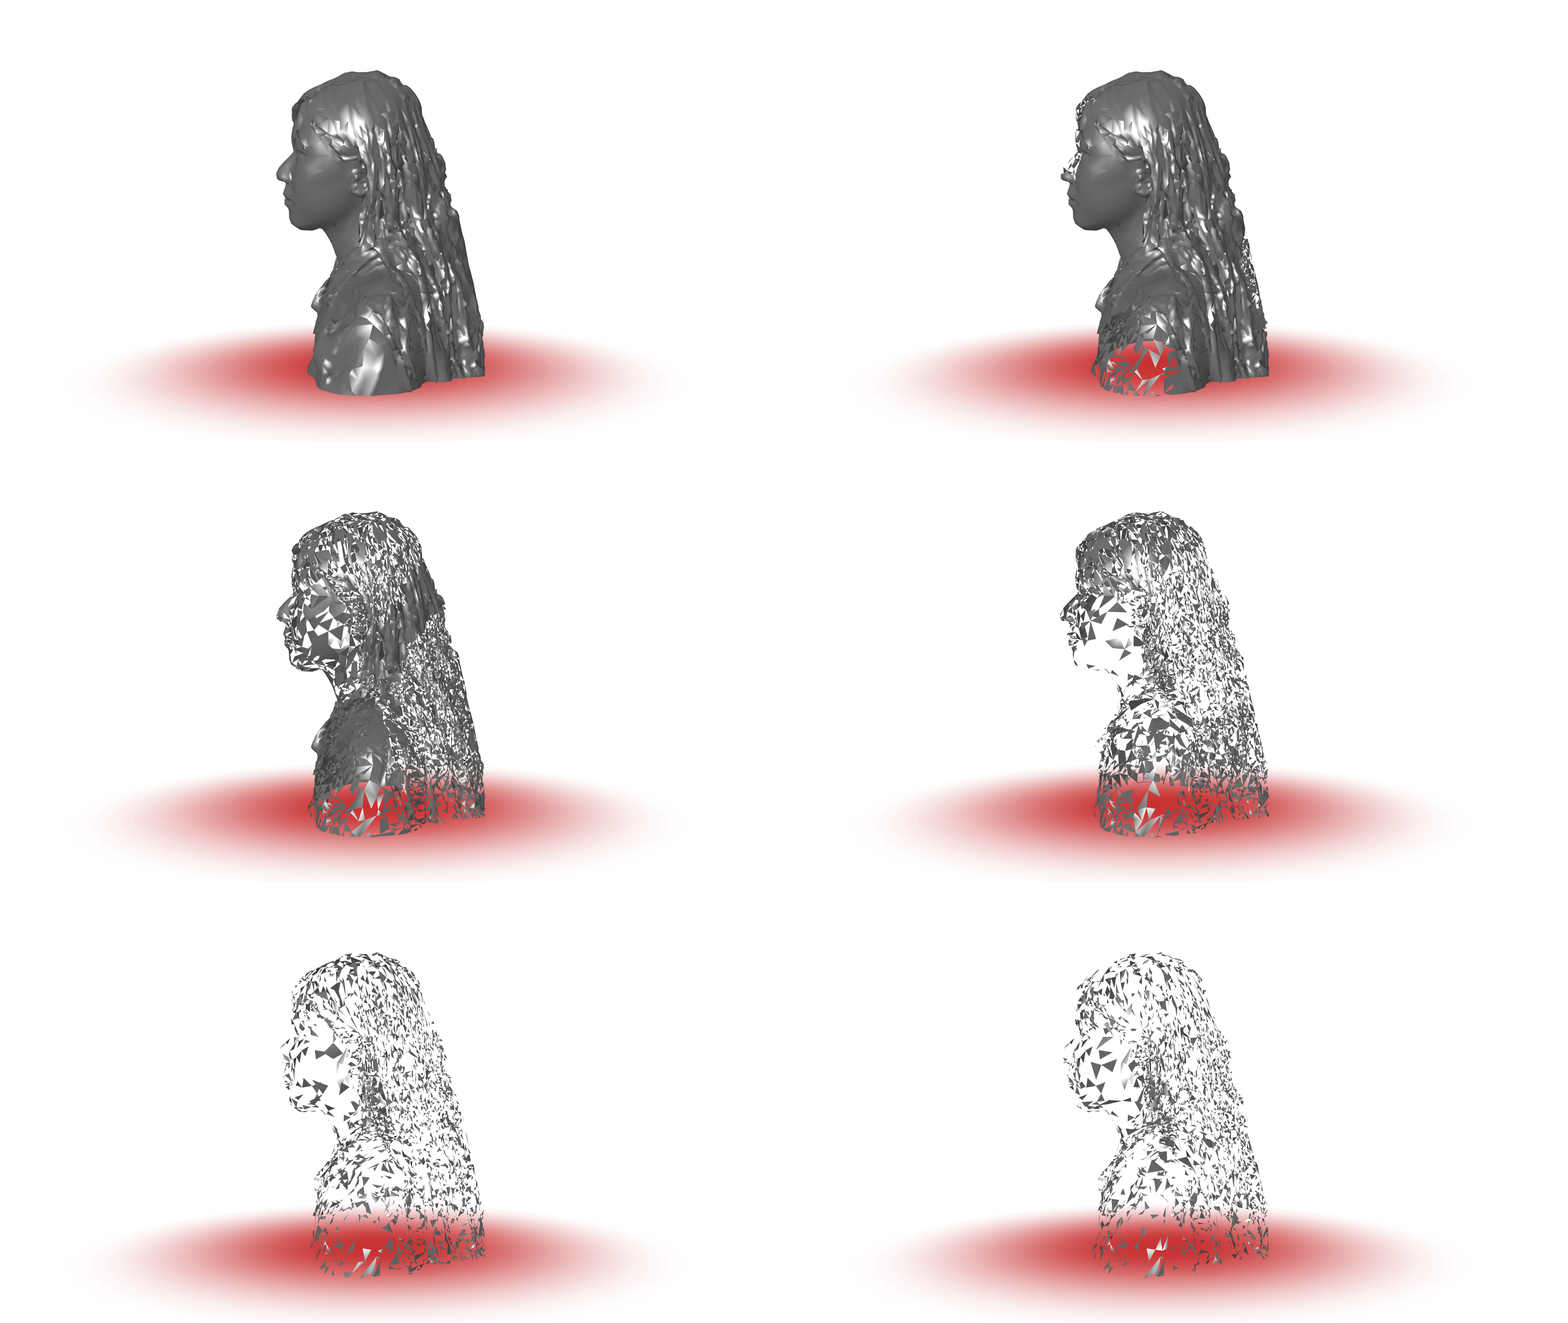 Remove faces
 Split Meshes
Boolean meshes from 3 point
